Address
304 North Cardinal St.
Dorchester Center, MA 02124
Work Hours
Monday to Friday: 7AM - 7PM
Weekend: 10AM - 5PM
Address
304 North Cardinal St.
Dorchester Center, MA 02124
Work Hours
Monday to Friday: 7AM - 7PM
Weekend: 10AM - 5PM


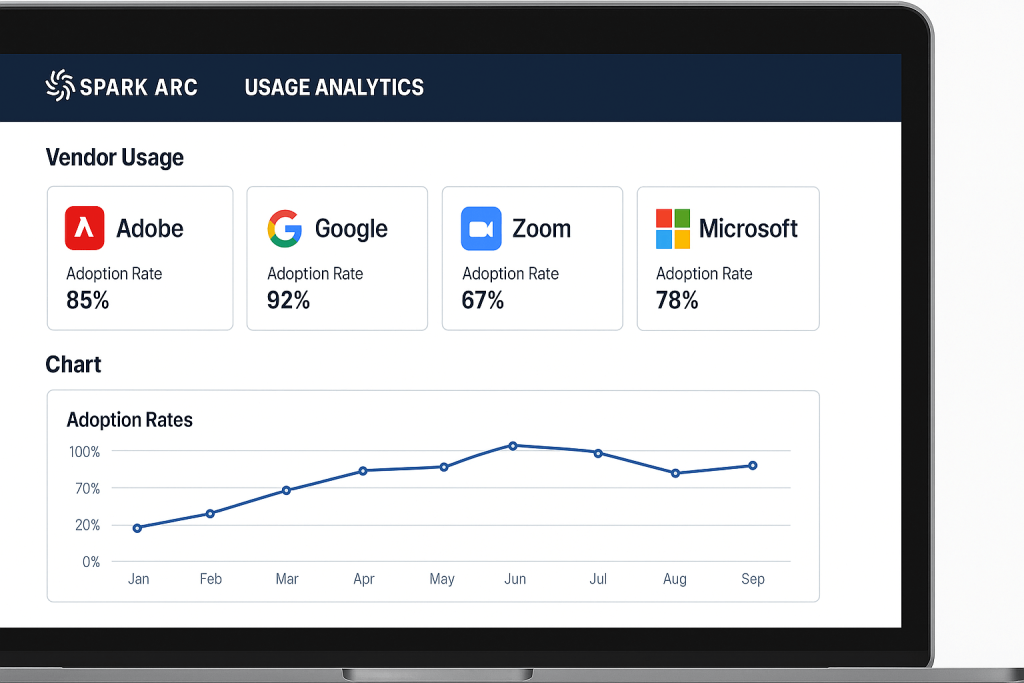
Are your Adobe, Microsoft, and Google licenses actually being used—or just sitting idle?
Spark Arc IT Usage Analytics connects to each vendor’s admin portal and pulls real-time adoption data into one clean dashboard. Track log-ins, app usage minutes, storage, and device health per school, grade, or even individual class.
Decisions backed by evidence, not guesswork.
| Stakeholder | Insight Delivered |
|---|---|
| CIO / Technology Director | License utilization vs. spend, renewal timelines, device compliance. |
| Principals | School-level heat-maps show which grades need more PD or curriculum kits. |
| IT Admins | Alerts for inactive accounts, devices needing OS updates, and low cloud storage. |
| Curriculum Leads | Correlate app usage with assessment scores to prove instructional impact. |
| Metric | Why It Matters |
|---|---|
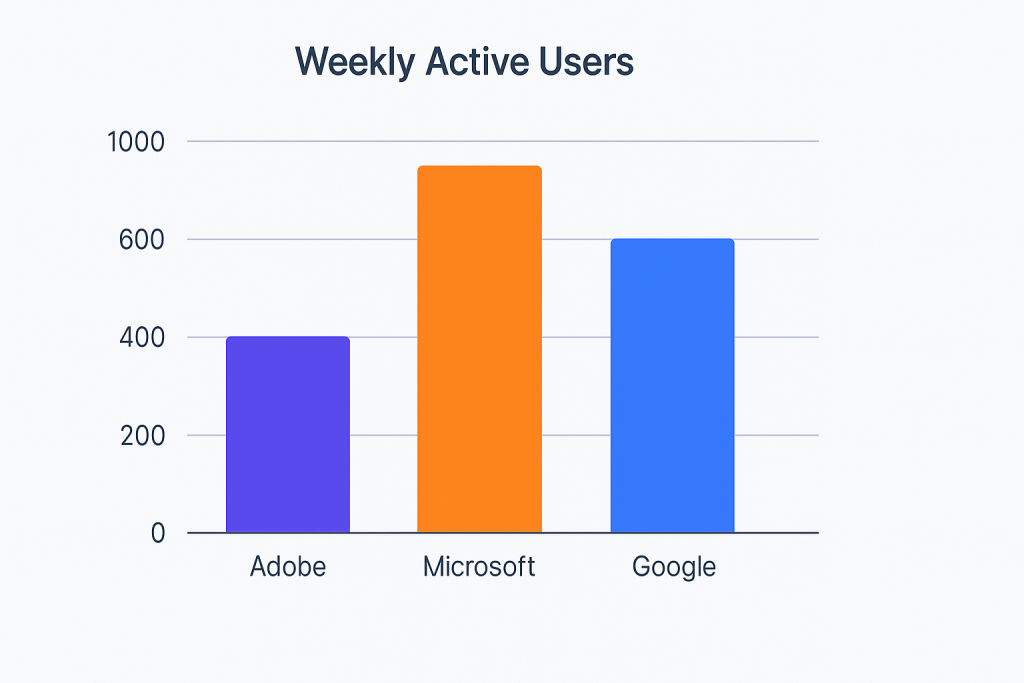
| Daily Active Users | Spot adoption trends and identify classrooms needing support. |
| Top Apps & Add-ons | See which tools drive engagement and trim unused licenses. |
| Device Compliance | View OS version, last check-in, and security status at a glance. |
| Storage & Bandwidth | Prevent overages and optimize cloud subscriptions. |
| PD Impact Score | Automatic pre/post PD usage comparison shows ROI on training. |

“Within one semester we re-allocated 350 unused licenses, saving $18 k, and focused PD on grades 4-5 where usage lagged. Spark Arc’s analytics turned raw log files into clear next steps.”
— Karen Douglas, CTO, Maple Ridge School District
Gain a 30-day pilot of Usage Analytics—complete with onboarding and a custom ROI report.